Articles by "Mechanics"

3D printing Aerodynamic engineering Aeronautical engineering Aeronautical engineering books Airports Architecture Artificial intelligence Automobiles Blast Resistant Design Books Bridges Building Codes Cabin Systems Civil Engineering Codes Concrete Conferences Construction Management Construction Materials Cooling Cryptocurrency Dams Do it Yourself Docks and Harbours Downloads Earthquake Engineering Electronics Engineering Engines Environmental Design & Construction Environmental Engineering Estimation Fluid Mechanics Fluid Mechanics Books Formwork design foundation engineering General Geotech Books Geotechnical Engineering Global Positioning System HVAC Hydraulics Hydraulics Books Hydro Power Hydrology Irrigation Engineering Machinery Magazines Management Books Masonry Mechanical Engineering Mechanics Mechanics Books Miscellaneous Books Modern Steel Construction Nanotechnology Natural Hazards Network Security Engineer Networking Systems News Noise and Attenuation Nuclear Engineering Nuclear Hazards to Buildings Pavement Design Prestressed Concrete Project Management Project Management Books Quantity Survey Quantity Survey Books railways RCC Structural Designing Remote Sensing Remote Sensing and GIS Books Renewable Energy Reports Resume Roads scholarships Smart devices Software Software Engineering Soil Mechanics Solar Energy Special Concrete Spreadsheets Steel Steel Spreadsheets Structural Analyses structures Structures Books Surveying Surveying Books Testing Thermodynamics Thesis Transportation Books Transportation Engineering Tunnel Engineering Wind Energy Zero Energy Buildings
Showing posts with label Mechanics. Show all posts

Force

The concept of force can be taken from our daily experience. Although forces cannot be seen or directly observed, we are familiar with their effects. For example, a helical spring stretches when a weight is hung on it or it is pulled. Our muscle tension conveys a qualitative feeling of the force in the spring. Similarly, a stone is accelerated by gravitational force during free fall, or by muscle force when it is thrown. Also, we feel the pressure of a body on our hand when we lift it. Assuming that gravity and its effects are known to us from experience, we can characterize a force as a quantity that is comparable to gravity.

In statics, bodies at rest are investigated. From experience we know that a body subject solely to the effect of gravity falls. To prevent a stone from falling, to keep it in equilibrium, we need to exert a force on it, for example our muscle force. In other words:
A force is a physical quantity that can be brought into equilibrium with gravity.
Characteristics and Representation of a Force
What is a Force and How to Represent it?
Figure 1
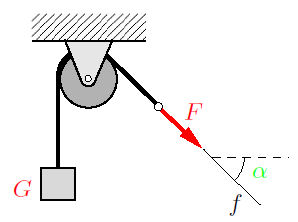
A single force is characterized by three properties: magnitude, direction, and point of application. The quantitative effect of a force is given by its magnitude. A qualitative feeling for the magnitude is conveyed by different muscle tensions when we lift different bodies or when we press against a wall with varying intensities. The magnitude F of a force can be measured by comparing it with gravity, i.e., with calibrated or standardized weights. If the body of weight G in Fig. 1 is in equilibrium, then F = G. The “Newton”, abbreviated N, is used as the unit of force.

From experience we also know that force has a direction. While gravity always has an effect downwards (towards the earth’s center), we can press against a tabletop in a perpendicular or in an inclined manner. The box on the smooth surface in Fig. 2 will move in different directions, depending on the direction of the force exerted upon it. The direction of the force can be described by its line of action and its sense of direction (orientation). In Fig. 1, the line of action f of the force F is inclined under the angle α to the horizontal. The sense of direction is indicated by the arrow.

What is a Force and How to Represent it?
Figure 2
What is a Force and How to Represent it?
Figure 3
Finally, a single force acts at a certain point of application. Depending on the location of point A in Fig. 2, the force will cause different movements of the box. A quantity determined by magnitude and direction is called a vector. In contrast to a free vector, which can be moved arbitrarily in space provided it maintains its direction, a force is tied to its line of action and has a point of application.
Therefore, we conclude:
The force is a bound vector.

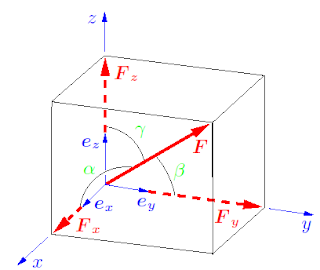
According to standard vector notation, a force is denoted by a boldfaced letter, for example by F, and its magnitude by |F| or simply by F. In figures, a force is represented by an arrow, as shown in Figs. 1 and 2. Since the vector character usually is uniquely determined through the arrow, it is usually sufficient to write only the magnitude F of the force next to the arrow. In Cartesian coordinates (see Fig. 3), the force vector can be represented using the unit vectors ex, ey, eby,

What is a Force and How to Represent it?

Applying Pythagorean theorem in space, the force vector’s magnitude F is given by

What is a Force and How to Represent it?

The direction angles and therefore the direction of the force follow from
What is a Force and How to Represent it?

The theoretical basis of the method of joints for truss analysis has already been discussed in this article '3 methods for truss analysis'. " 2 examples will be presented in this this article to clarify those concepts further.

Example 1

The truss shown in Fig. 1 is loaded by an external force F. Determine the forces at the supports and in the members of the truss.

Solved Examples for Method of Joints for Truss Analysis
Figure. 1
Solution:

Fig. 1a represents a simple truss that is completely constrained against motion. Therefore, it is statically determinate. The members of the truss are numbered in the free-body diagram of the complete truss (Fig. 1b). Zero-force members are identified by inspection and marked with zeroes: member 4 (according to Rule 2), the members 5 and 9 (Rule 3) and the members 10 and 13 (Rule 1). To further reduce the number of unknown forces, we compute the support forces by applying the equilibrium conditions to the whole truss.
Solved Examples for Method of Joints for Truss Analysis
Fig. 1c shows the free-body diagrams of the joints. As previously stated, we assume that every member is subjected to tension. Accordingly, all of the corresponding arrows point away from the joints. Zero-force members are omitted in the free-body diagrams. Therefore, joint VII need not be considered. Applying the equilibrium conditions to each joint yields
Solved Examples for Method of Joints for Truss Analysis
These are 11 equations for the 8 unknown forces in the members and the 3 forces at the supports. Since the support forces have been computed in advance and are already known, the analysis is simplified, and three equations may be used as a check on the correctness of the results. Using the geometrical relations
Solved Examples for Method of Joints for Truss Analysis
It is useful to present the results in dimensionless form in a table, including negative signs:
Solved Examples for Method of Joints for Truss Analysis
The negative values for the members 1, 2, 6, 7 and 11 indicate that these members are under compression.

Example 2

Fig. 2 shows a spatial truss loaded by two external forces F at the joints IV and V. Compute the forces in the members 1-6.
Solved Examples for Method of Joints for Truss Analysis
Figure. 2
Solution:

We free the joints V and IV by passing imaginary cuts through the bars, and we assume that the members 1-6 are in tension. The vector equations of equilibrium for these joints are given by
Solved Examples for Method of Joints for Truss Analysis

The initially unknown unit vectors can be determined from the vectors connecting adjacent joints, e.g., for e(V/VI) we obtain
Solved Examples for Method of Joints for Truss Analysis
Similarly, the other unit vectors are

Solved Examples for Method of Joints for Truss Analysis

Introducing these into the two vector equations we get the six scalar equations

Solved Examples for Method of Joints for Truss Analysis
Their solution yields the forces

Solved Examples for Method of Joints for Truss Analysis

A truss is a structure composed of slender members that are connected at their ends by joints. The truss is  one of the most important structures in engineering applications. After studying this chapter, students should be able to recognise if a given truss is statically and kinematically determinate. In addition, they will become familiar with methods to determine the internal forces in a statically determinate truss.

A structure that is composed of straight slender members is called a truss. To be able to determine the internal forces in the individual members, the following assumptions are made:

1. The members are connected through smooth pins (frictionless joints).
2. External forces are applied at the pins only.

A truss that satisfies these assumptions is called an “ideal truss”. Its members are subjected to tension or to compression only. In real trusses, these ideal conditions are not exactly satisfied. For example, the joints may not be frictionless, or the ends of the members may be welded to a gusset plate. Even then, the assumption of frictionless pin-jointed connections yields satisfactory results if the axes of the members are concurrent at the joints. Also, external forces may be applied along the axes of the members (e.g., the weights of the members). Such forces are either neglected (e.g., if the weights of the members are small in comparison with the loads) or their resultants are replaced by statically equivalent forces at the adjacent pins.
Statically Determinate Trusses
Fig. 1

In this article we focus on plane trusses; space trusses can be treated using the same methods. As an example, consider the truss shown in Fig. 1. It consists of 11 members which are connected with 7 pins (the pins at the supports are also counted). The members are marked with Arabic numerals and the pins with Roman numerals.

To determine the internal forces in the members we may draw a free-body diagram for every joint of the truss. Since the forces at the pins are concurrent forces, there are two equilibrium conditions at each joint. In the present example, we thus have 7·2 = 14 equations for the 14 unknown forces (11 forces in the members and 3 forces at the supports).

A truss is called statically determinate if all the unknown forces, i.e., the forces in the members and the forces at the supports, can be determined from the equilibrium conditions. Let a plane truss be composed of m members connected through j joints, and let the number of support reactions be r. In order to be able to determine the m + r unknown forces from the 2j equilibrium conditions, the number of unknowns has to be equal to the number of equations:

2 j = m + r (Equation 1)

This is a necessary condition for the determinacy of a plane truss. As we shall discuss later, however, it will not be sufficient in cases of improper support or arrangement of the members. If the truss is rigid, the number of support reactions must be r = 3. In the case of a space truss, there exist three conditions of equilibrium at each joint, resulting in a total of 3 j equations.
Therefore,
3 j = m + r (Equation 2)


is the corresponding necessary condition for a space truss. If the truss is a rigid body, the support must be statically determinate: r = 6.
Understanding trusses
Fig. 2

For the truss shown in Fig. 2a we have j = 7, m = 10 and r = 2 · 2 (two pin connections). Hence, since 2 · 7 = 10+4, the necessary condition (Equation 1) is satisfied. The truss is, in addition, completely constrained against motion. Therefore, it is statically determinate.

A truss that is completely constrained against motion is called a kinematically determinate truss. In contrast, a truss that is not a rigid structure and therefore able to move is called kinematically indeterminate. This is the case if there are fewer unknowns than independent equilibrium conditions. If there are more unknowns than equilibrium conditions, the system is called statically indeterminate. We shall only consider trusses that satisfy the necessary conditions stated in Equations (1) or (2), respectively. Even then, a truss will not be statically determinate if the members or the supports are improperly arranged. Consider, for example, the trusses shown in Figs. 2b and 2c. With j = 6, m = 9 and r = 3 the necessary condition (1) is satisfied. However, the members 7 and 8 of the truss in Fig. 2b may rotate about a finite angle ϕ, whereas the members 5 and 8 of the truss in Fig. 2c may rotate about an infinitesimally small angle dϕ. Each of the improperly constrained trusses is statically indeterminate.

These articles might also interest you:
 Analysis of 2D Truss Structure in SAP 2000
3 Methods for Truss Analysis

When a beam is subjected to applied forces, internal forces develop in the beam. Since the beam has supports and the system is in an equilibrium condition, the beam should resist these internal forces. This type of force is called shear force, or simply shear. The magnitude of the shear has a direct effect on the magnitude of the shear stress in the beam, and also on the design and analysis of the structural members.
Shear forces develop along the entire length of the beam, and their magnitude varies at each cross section of the beam. They actually act perpendicularly to the longitudinal axis of the beam. Our main objectives in finding the shear in beams are twofold. First, we have to know the maximum value of the shear in order to design the beam properly so that it can resist overall shear and will not fail when it is loaded.
The second objective is to calculate the values of shear along the length of the beam, so that we can find out where the beam fails under bending and where the shear value is zero.

As mentioned earlier, the designer must first know the magnitude of the shear force at any section of the beam to get the right picture of beam design. The magnitude of shear force at any section of the beam is equal to the sum of all the vertical forces either to the right or to the left of the section. To compute the shear force for any section of the beam, we simply call the upward forces (reactions) positive and downward forces (loads) negative. Then, the magnitude of the shear force at any section of the beam is equal to sum of the reactions minus the sum of the loads to the left of the section. This can be stated as:
Shear = Reactions - Loads
Example:
Find the shear force at sections C, D, and E for the simply supported beam shown (Fig. 1).
Computation of Shear Force
Figure 1
First, we calculate the reactions.

RA + RB = 15,000 lb 

Using the moment equilibrium equation,

RA(10) - 5000(8) -10,000(2) = 0
10(RA) = 60,000
RA = 6000 lb
and
RB = 9000 lb

Point C

We usually represent a shear force by V, and we designate this shear force at C as Vc.
Vc = +6000 - 0 = 6000lb

Point D

Vd =  +6000 - 5000 = +1000 lb

Point E


Ve = +6000 - 5000 - 10,000 = -9000 lb

Stepan Prokopovych Timoshenko was born on December 22, 1878 in the village of Shpotivka in the Ukrain. Timoshenko’s early life seems to have been a happy one in pleasant rural surroundings. He studied at a “realnaya” school from 1889 to 1896.
Stephen P. Timoshenko (1878–1972)

Timoshenko continued his education towards a university degree at the St. Petersburg Institute of Engineering. After graduating in 1901, he stayed on teaching in this same institution from 1901 to 1903 and then worked at the St. Petersburg Polytechnic Institute under Viktor Kyrpychov 1903–1906. His restlessness and discontent with the educational system extant in Russia at that time motivated the young Timoshenko to venture out to explore, examine, and assimilate diverse pedagogical views and cultures in France, Germany, and England. In 1905 he was sent for 1 year to the University of Göttingen where he worked under Ludwig Prandtl.

In the fall of 1906 he was appointed to the Chair of Strengths of Materials at the Kyiv Polytechnic Institute. Thanks to his tormented spirit at this institute, Timoshenko took the plunge to writing his maiden Russian classic, Strength of Materials in 1908 (Part I) and 1910 (Part II). From 1907 to 1911 as a professor at the Polytechnic Institute he did research in the area of finite element methods of elastic calculations, and did excellent research work on buckling. He was elected dean of the Division of Structural Engineering in 1909.

In 1911 he was awarded the D. I. Zhuravski prize of St. Petersburg; he went there to work as a Professor in the Electro-technical Institute and the St. Petersburg Institute of the Railways (1911–1917). During that time he developed the theory of elasticity and the theory of beam deflection, and continued to study buckling. In 1922 Timoshenko moved to the United States where he worked for the Westinghouse Electric Corporation from 1923 to 1927, after which he became a faculty professor at the University of Michigan where he created the first bachelor’s and doctoral programs in engineering mechanics. His textbooks have been published in 36 languages. His first textbooks and papers were written in Russian; later in his life, he published mostly in English.

Moment of Inertia
The moment of inertia of an area is the capacity of a cross section to resist bending or buckling. It represents a mathematical concept that is dependent on the size and shape of the section of the member. The bending axis of a member is also the centroidal axis; therefore, the ability to locate the centroid of a shape is closely associated with moment of inertia. Engineers use the moment of inertia to determine the state of stress in a section, and determine the amount of deflection in a beam.
The definition of the moment of inertia of an area can be thought of as the sum of the products of all the small areas and the squares of their distances from the axis being considered. This gives
If we represent the moment of inertia by the letter I, then the moments of inertia with respect to the x and y axis axis are
Units
Moment of inertia is expressed in units of length to the fourth power. Although dimensionally speaking it seems unusual, it is just a mathematical abstract and is an important property in the design of beams and columns. We will see in the following examples the methods of calculating the moment of inertia for a given beam section subjected to bending. If we choose the unit of length as mm., then the unit of the moment of inertia is

mm2 x mm2 = mm4

Beams are stressed when they bend because the action of bending causes an elongation on one side, resulting in tension, and a shortening on the other side, resulting in compression. By exaggerating the curvature of the beam as it bends, this elongation and shortening can be visualized. Exactly where the tension and compression are depends on how the beam is loaded and how it is supported.
Bending Stress
FIGURE 1 Behavior of a simply supported beam
For simply supported beams with downward-acting loads (i.e., with gravity loads), the beam is stretched on the bottom (tension) and shortened on the top (compression) as shown in Figure 1 .
For cantilevered beams fixed at one end, with downward-acting loads, the beam is stretched on the top and shortened on the bottom ( Figure 2).
Bending Stress
FIGURE 2 Behavior of a cantilevered beam
For continuous beams spanning over several supports, the changing curvature causes the position of tension and compression zones to reverse a number of times over the length of the beam, as illustrated in Figure 3 .
Bending Stress
FIGURE 3 Behavior of a continuous beam
The relative position of tension and compression within the beam’s cross section is directly related to the sign of the bending moment at that cross section. As can be seen from Figure 4a, a counterclockwise moment on the right side of a freebody diagram is equivalent to a distribution of bending stress with compression on the top and tension on the bottom of the beam: “ positive ” bending (and “ positive ” bending moment). Figure 4b shows a free-body diagram cut through a cantilever beam with “ negative ” bending — that is, tension on the top and compression on the bottom corresponding to a clockwise moment as shown. The reversing curvature of a continuous beam, such as that shown in Figure 3 , corresponds precisely to a reversal in the sign of the bending moment. As shown in Figure 5, points of inflection (points where the curvature changes) always occur at points of zero moment.
FIGURE 4 Comparison of “ positive ” and “ negative ” bending in (a) a simply supported beam and (b) a cantilevered beam
Continuous beam showing correspondence of points of inflection (change from positive to negative curvature) and points of zero moment
FIGURE 5 Continuous beam showing correspondence of points of inflection (change from positive to negative curvature) and points of zero moment


Bending stresses within these beams can be computed if we assume that the stretching and shortening that take place at any cross section are linear; that is, a straight line connecting a stretched point with a shortened point on any cross sectional cut will accurately describe the shape of the beam throughout the entire cross section (Figure 6).
FIGURE 6 Shortening and stretching (compression and tension) at a typical beam cross section

Three observations can be made once this assumption is accepted:
(1) maximum elongation and shortening occur at the top and bottom of the beam (the “extreme fibers” );
(2) a surface exists somewhere between the extreme fibers that is neither elongated nor shortened this “ plane ” is called the “ neutral axis ” or “neutral surface” ; and 3) strain can be defined as the elongation or shortening of any portion of the beam, divided by its original (unloaded) length. Since the original length is a constant, a strain diagram has the same shape as an “ elongation-shortening diagram. ”
Elongation, strain, and stress diagrams for a linear, elastic material
FIGURE 7 Elongation, strain, and stress diagrams for a linear, elastic material
For materials with linear stress-strain relationships (where stress equals strain times a constant modulus of elasticity ), a stress diagram will also have the same shape as the strain or “ elongation-shortening diagram. ” Figure 7 compares these diagram shapes for materials with linear stress-strain relationships. For materials with nonlinear stress-strain relationships, a stress diagram can be pieced together by plotting points from a stress-strain curve for the material. Thus, a steel beam stressed beyond its elastic region would have stress and strain distributions as shown in Figure 8. The elongation and shortening, shown in Figure 8a , and therefore the strain, shown in Figure 8b, are assumed to remain linear even when the stress, shown in Figure 8d through Figure 8f , becomes nonlinear.
FIGURE 8 Elongation, strain, and stress diagrams for an elastic-plastic material such as steel showing (a) elongation and shortening of the actual material, (b) strain diagrams, (c) stress diagram at the point where the outer fi ber has just yielded, (d) stress diagram corresponding to strain just beyond the elastic limit, (e) stress diagram corresponding to continued strain beyond the elastic limit, (f) stress diagram corresponding to the plastic moment (where the entire cross section has yielded), and (g) stress-strain diagram

In Figure 8c , the stresses at the extreme fibers of the cross section just reach the limit of elastic behavior (with stress, σy ), which corresponds to the so-called elastic moment , Me . In Figure 8f , the strain at the outer fiber is extremely large (theoretically infinite), and the entire cross section is assumed to have yielded at the stress, σy , that is, moved past the linear-elastic yield strain labeled “1” in Figure 8g.

This condition represents the limit state for a steel beam, and corresponds to the so-called plastic moment , Mp . For reinforced concrete, a nonlinear stress-strain relationship is most often assumed for design; special procedures have been developed to simplify the construction of these stress diagrams.

The shape of the stress diagram is a key element in determining the magnitudes of stresses within the beam: when combined with the cross-sectional shape, the requirements of equilibrium can be used to fi nd the magnitudes of the stresses. Typical stress diagrams are shown in Figure 9 corresponding to the allowable moment for wood and the limit states for steel and reinforced concrete.
FIGURE 8 Bending stresses acting on rectangular cross sections corresponding to the (a) allowable moment for wood and the limit states (maximum moment at failure) for (b) steel and (c) reinforced concrete

Author Name

Engineeersdaily

Contact Form

Name

Email *

Message *

Powered by Blogger.